Confirming Results
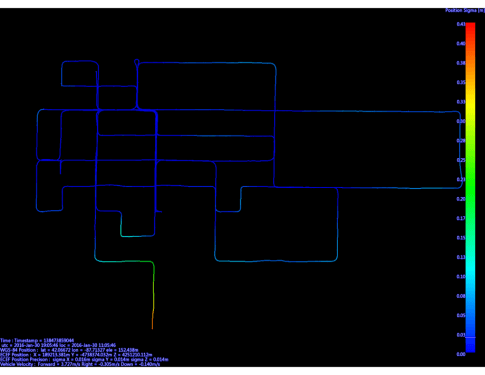
- Set the display color of the trajectory to Position Sigma. This can be done by selecting View → Trajectory Color → Position Sigma,
- Place the cursor on the trajectory in the 3D map view to display the standard deviation with a color bar at the point on the right.
- The trajectory is color-coded based on the standard deviation.
